


XbarRChart app for iPhone and iPad
Developer: APPSKOUSIKA SOTWARE DEVELOPERS (OPC) PRIVATE LIMITED
First release : 20 Feb 2012
App size: 477 Kb
Xbar and R chart are used to check whether the given process is under Control.These charts are used as tools of SPC(Statistical Process Control).
Each subgroup need to have two or more measurements/readings but less than or equal to nine measurements.Two or more subgroups but preferably less than or equal to twenty subgroups are needed.
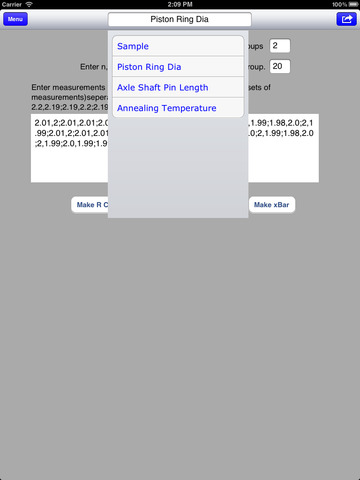
First, name the Process and enter number of measurements per subgroup(n),and enter number of subgroups(k).
Then enter measurements/readings separated by comma(,) and enter subgroups separated by semicolon(;).
Example 2.01,2;2.01,2.01;2.013,2.01;2.0,1.99;1.99,2.01;2.01,2.0;2,1.99;1.98,2.0;2,1.99;2.01,2;2.01,2.01;2.013,2.01;2.0,1.99;1.99,2.01;2.01,2.0;2,1.99;1.98,2.0;2,1.99;2.0,1.99;1.99,2.01
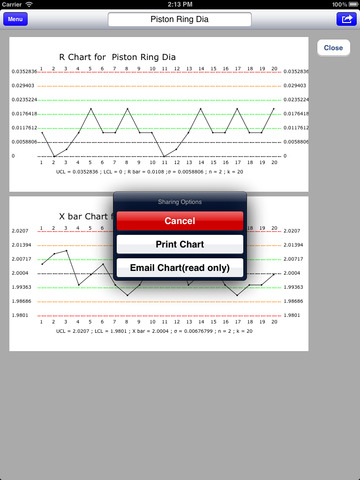
As a first step make R Chart.If you find the R chart to be valid (within limits),close the chart and make x bar chart.The following points on x bar chart indicates out of control(SPC) process:
a. one point outside the 3 sigma control limits
b. eight successive points on the same side of the centerline
c. six successive points that increase or decrease
d. two out of three points that are on the same side of the centerline,
both at a distance exceeding 2 sigma’s from the centerline
e. four out of five points that are on the same side of the centerline,
four at a distance exceeding 1 sigma from the centerline
As you make the R chart the details are saved.You can open Sample group List(Menu > sample group list) to find the saved details and charts.You can share the charts(print/email).Menu > New Sample Group enables you to make new charts.